Completed Projects
These are only some of my favorite projects; many, many more can be found in my GitHub Repositories.
Understanding Litter Patterns at Large Events. 

- Clustering Analysis
July 21, 2021 In collaboration with Rubbish, co., we measured the efficacy of waste bins utilizing Clustering Analysis techniques, finding that placing bins no more than 40 feet apart should help minimize the litter impact at large events. The Analysis walks through the entire process to measure the efficacy of waste bins, as well as my reccomendations for future litter collection initiatives for large events. While the Medium article displays a high-level overview of the insights and impacts gained from this analysis. The data contains 2,437 points of litter collected from the Startup Grind 2020 event in San Francisco, California. While the litter itself was collected by the Rubbish team.


TrumpGen: What nickname would Trump give you? 
- Deep Learning Language Generation
January 1, 2021 I walk through the initial analysis and creation, training, and implementation of a LSTM Neural Network model utilizing nicknames given by Donald Trump, using data scraped directly from Wikipedia. The trained model predicts the most likely nickname a given name would have, based solely on Trump’s nickname vocabulary. The Analysis walks through the basic Exploratory Data Analysis done on the dataset, to examine its applicability for Deep Learning and navigating the challenges of producing generative text with a low volume of data (n=162). The Notebook walks through all the steps, from encoding affix embeddings to decoding the probability distributions, to extract the most likely nickname. I also implemented the model to a Phoenix based Web Application using Elixir to interface with Python directly. (currently working on displaying this in a good format.)

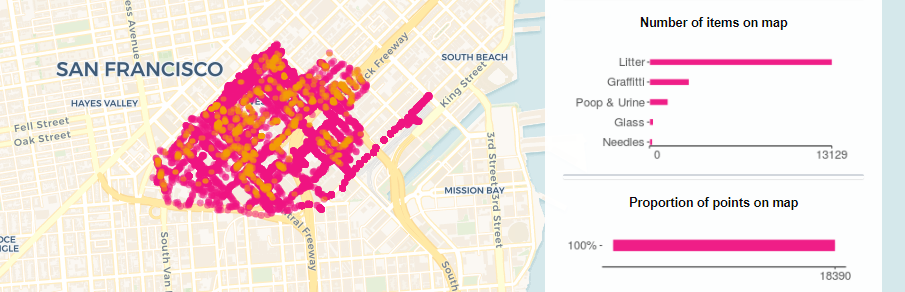
Where’s the Rubbish at?
- Data Visualization
October 1, 2020 I collaborated with Rubbish, co. to visualize their community-led trash cleanup of SoMa West, CA, which contained over 25,000 points of litter and issues collected! This data dashboard was created using R Shiny and Python, and the original dataset can even be downloaded for public use!

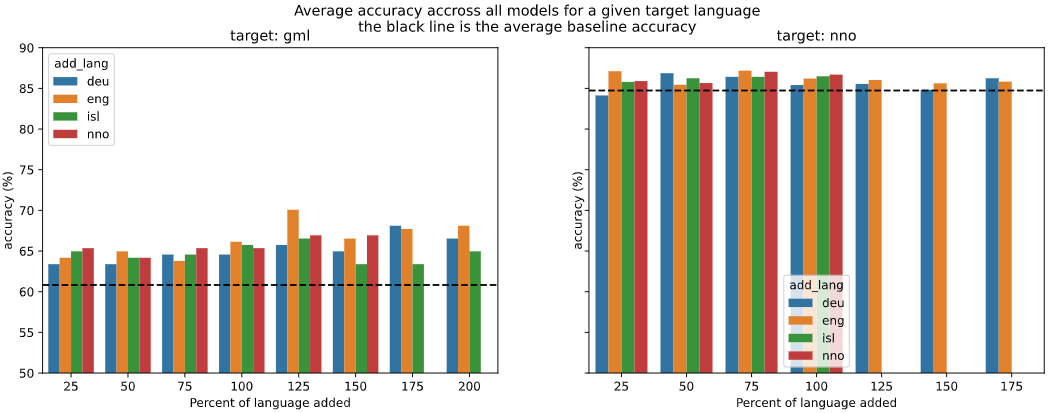
How do you morphologically inflect ‘vorswinden’?
- Deep Learning, Research
August 25, 2020 Utilizing the results and data from Sigmorphon 2020 Task 0 we improved the accuracy of Morphological Inflection in Low-Resouce Languages by 5%, namely Middle Low German (GML) and Norwegian Nynorsk (NNO). We accomplished this without the need to change the architecture of the neural network, instead we combined other targeted High-Resource Languages and our given Low-Resource Language, such as English and German being added to Middle Low German data, to artificially add volume that imrpoved inflection predictions of the Low-Resouce Language.

Hotel Bookings, Canceled or Not?
- Machine Learning, Classification
April 30, 2020 Using Trivago’s hotel booking data, I walk through an in-depth feature analysis to find important fields that could be used to improve customer retention. I also walk through the implementation of the three presented Random Forest models for predicting whether a customer will cancel their booking prior to arrival, each with their own benefits of reducing incorrectly predicted cancelations (False Negative Rate) and improving the correctly guessed cancelations (True Positive Rate).
| Proposed Model | Accuracy | False Negative Rate | True Positive Rate | ROC | Confidence Threshold |
|---|---|---|---|---|---|
| Model 1 | 0.7846 | 0.05247 | 0.36362 | 0.91189 | 0.63 |
| Model 2 | 0.7683 | 0.01623 | 0.19981 | 0.92109 | 0.8 |
| Model 3 | 0.7878 | 0.03687 | 0.30815 | 0.91513 | 0.7 |
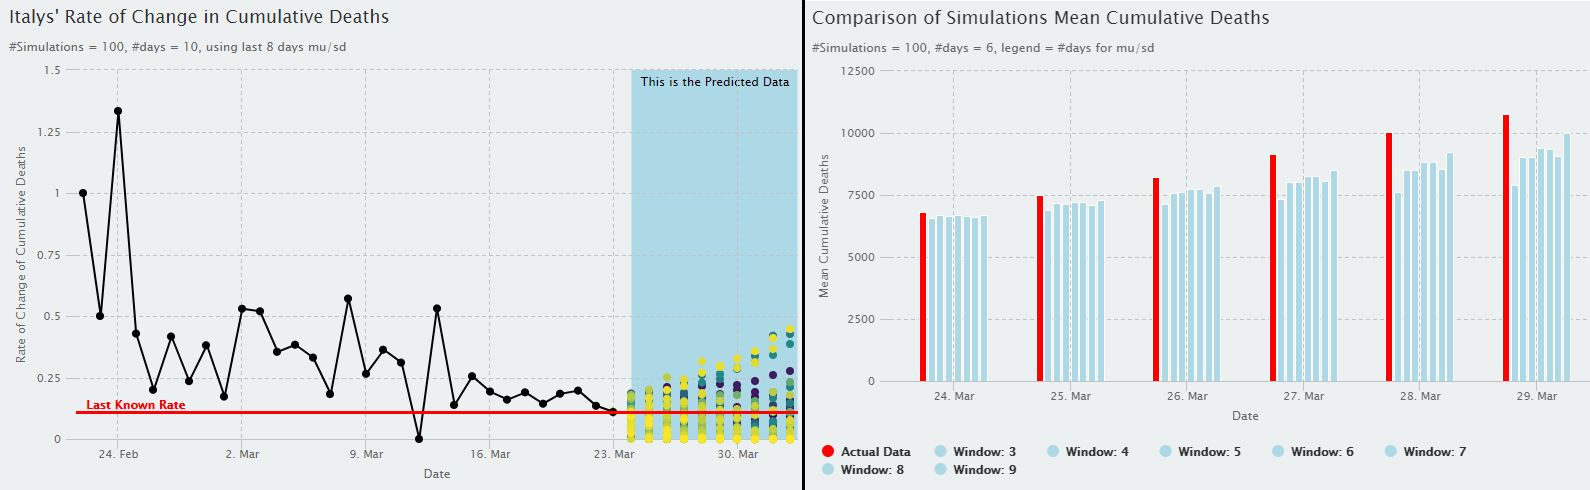
Predicting COVID-19 in Italy.
- Predictive Analysis
March 24, 2020 I walk through the full process of manipulating the raw COVID-19 data from a compilation of John Hopkins’ dataset, analyzing the data for patterns, and creating and implementing a hand built Markov Chain type Monte Carlo Algorithm to predict the future number of Cumulative Deceased Cases in Italy. The predictions had great accuracy to the actual reported cases, especially as only 2 months of data was used. However, this accuracy tends to drop off over time, showing this is a better short-term predictor.
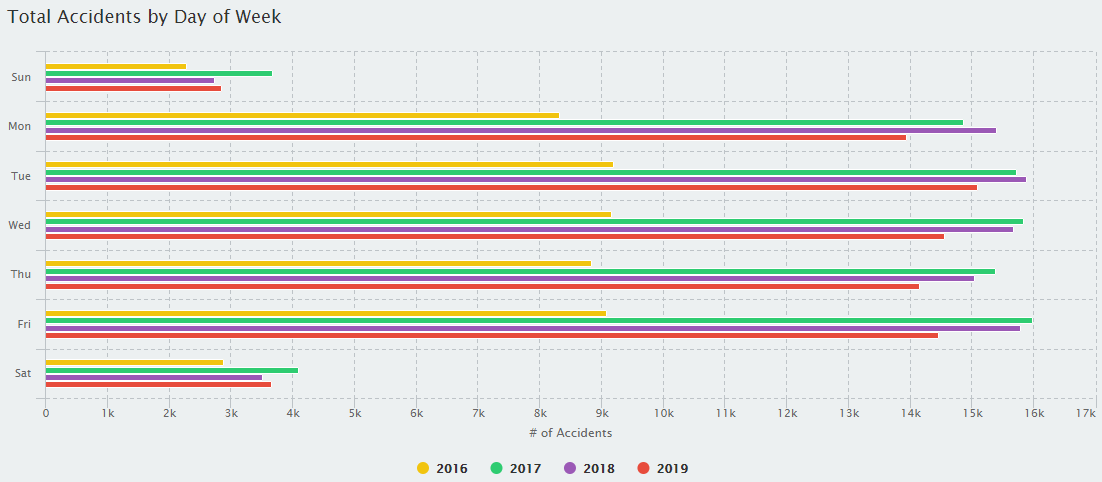
Weekday vs Weekend: Accident Analysis in Texas.
- Exploratory Data Analysis
April 21, 2020 In this group Data Analysis we dive into exploring the patterns in Texas Accidents from the middle of 2014 to the end of 2019. Along with a general analysis of the dataset, we found patterns that showed the number of accidents drop significantly during the weekend (as expected). We also ranked the highways and intersates to show which are the worst for Weekdays and Weekends respectively. Finally, we created an interactive graph that can be used to visually explore all the data across texas.